
Data
Browsing your data
Records live in an ordinary database on the device. The lists behave like a data grid — you can inspect and correct your own observations without a round trip to a server. Column choice and filtering are available on every list, sorting by column header on a tablet, and every row opens directly into the record's edit form.
The lists
Five lists cover the records you will check most often.
| List | What it holds |
|---|---|
| Observations | Every taxon occurrence recorded in the project, with its form fields, position, timestamp and attached photos |
| Localities | Named places used as spatial anchors for visits and observations |
| Visits | Survey events that group observations made at one locality over one session; see Recording observations |
| Taxa | The species list for this project — the taxa actually recorded — with a switch to browse the full reference taxonomy |
| Files | Photos and attachments across the whole project, shown as a grid or gallery |
The observation list
The observation list is the main working view for checking what was recorded. On a tablet, tap a column header to sort by it and tap again to reverse the order. Tap any row to open the observation's detail form, where you can correct any field and save.
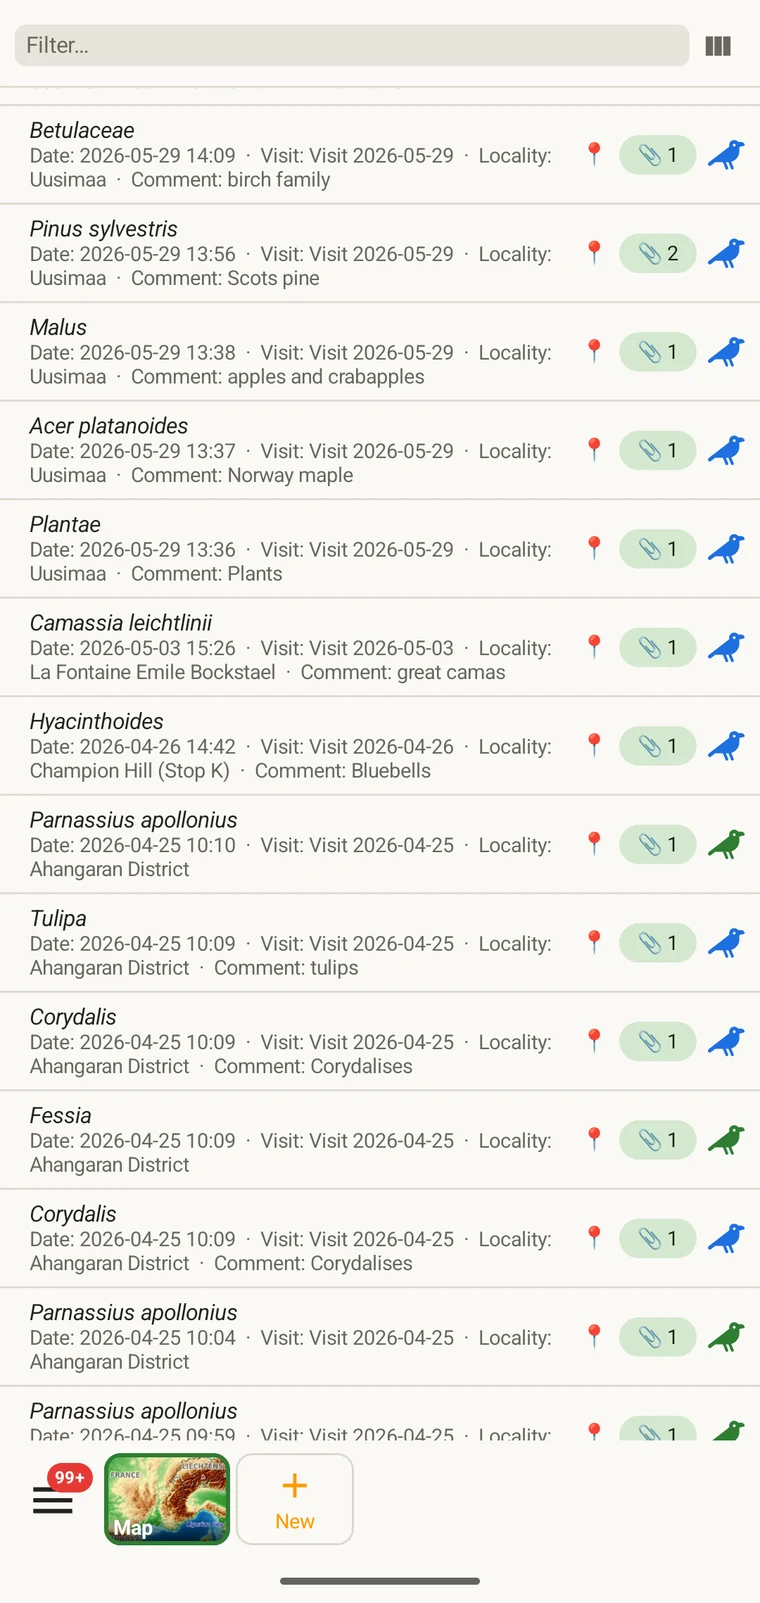
The list always shows the project's complete set of observations. On a tablet, use sorting to spot outliers — sorting by date surfaces any records with an implausible timestamp, and sorting by taxon groups occurrences of the same species so you can compare their field values.
Choosing columns
The column picker lets you select which fields appear in the list. Tap the column-picker icon to open it.
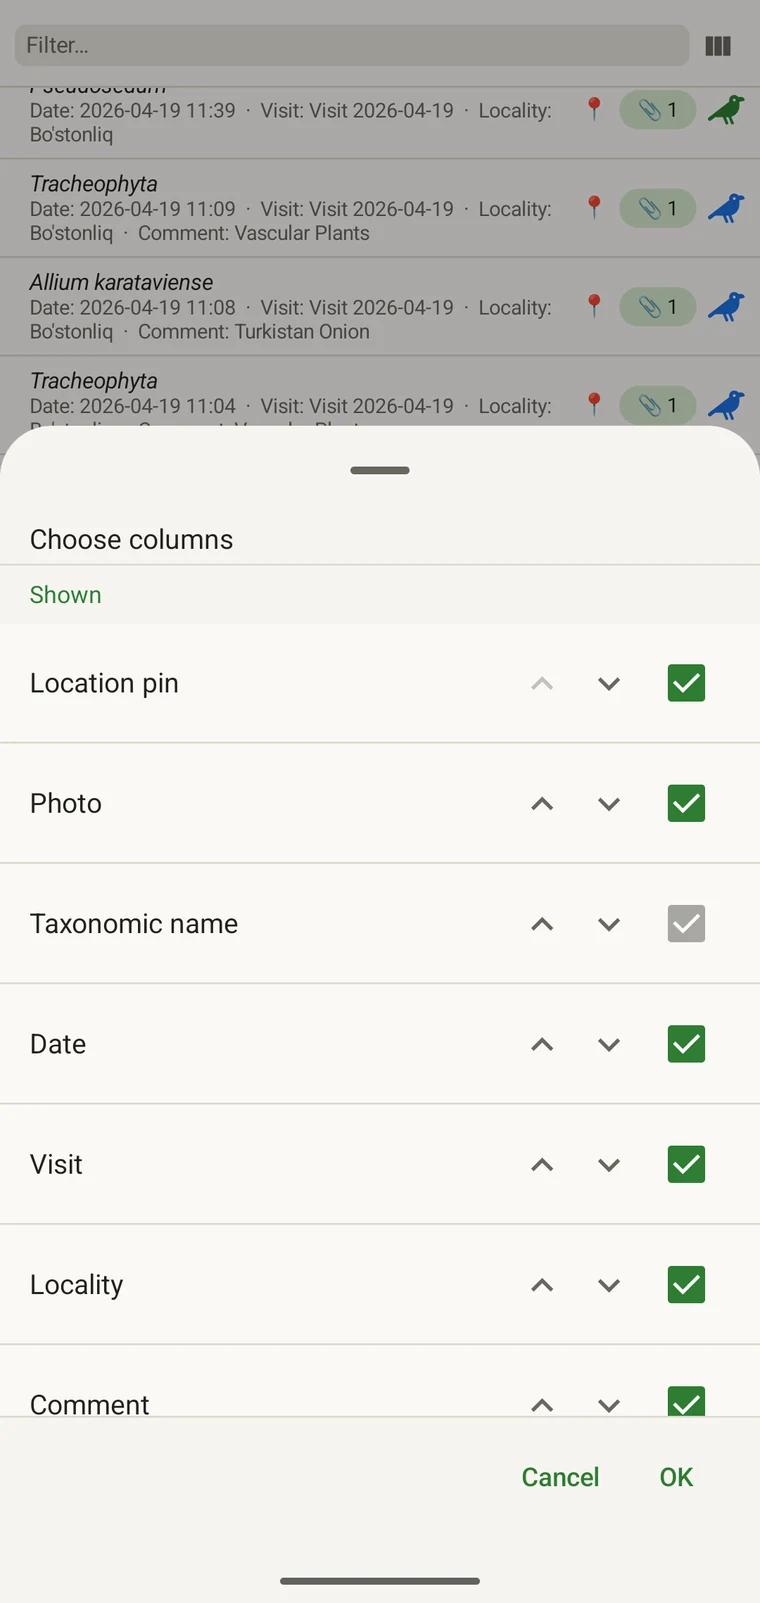
Every custom field appears in the picker; Show in list only decides whether it is on by default (see Forms and custom fields). A practical approach: put the two or three fields you are checking for errors into the list so a visual scan catches them without opening individual records. If you are checking whether abundance counts were filled in, add that column; if you are verifying that the observer name is consistent, add that one instead.
Filtering
Type in the filter box above the list to narrow it. On a phone one box matches your text against every column shown in the list — taxon, date, visit, locality, comment and any custom column you have added. On a tablet each column has its own filter box under the header, and the boxes combine: typing in two columns returns only rows that match both.
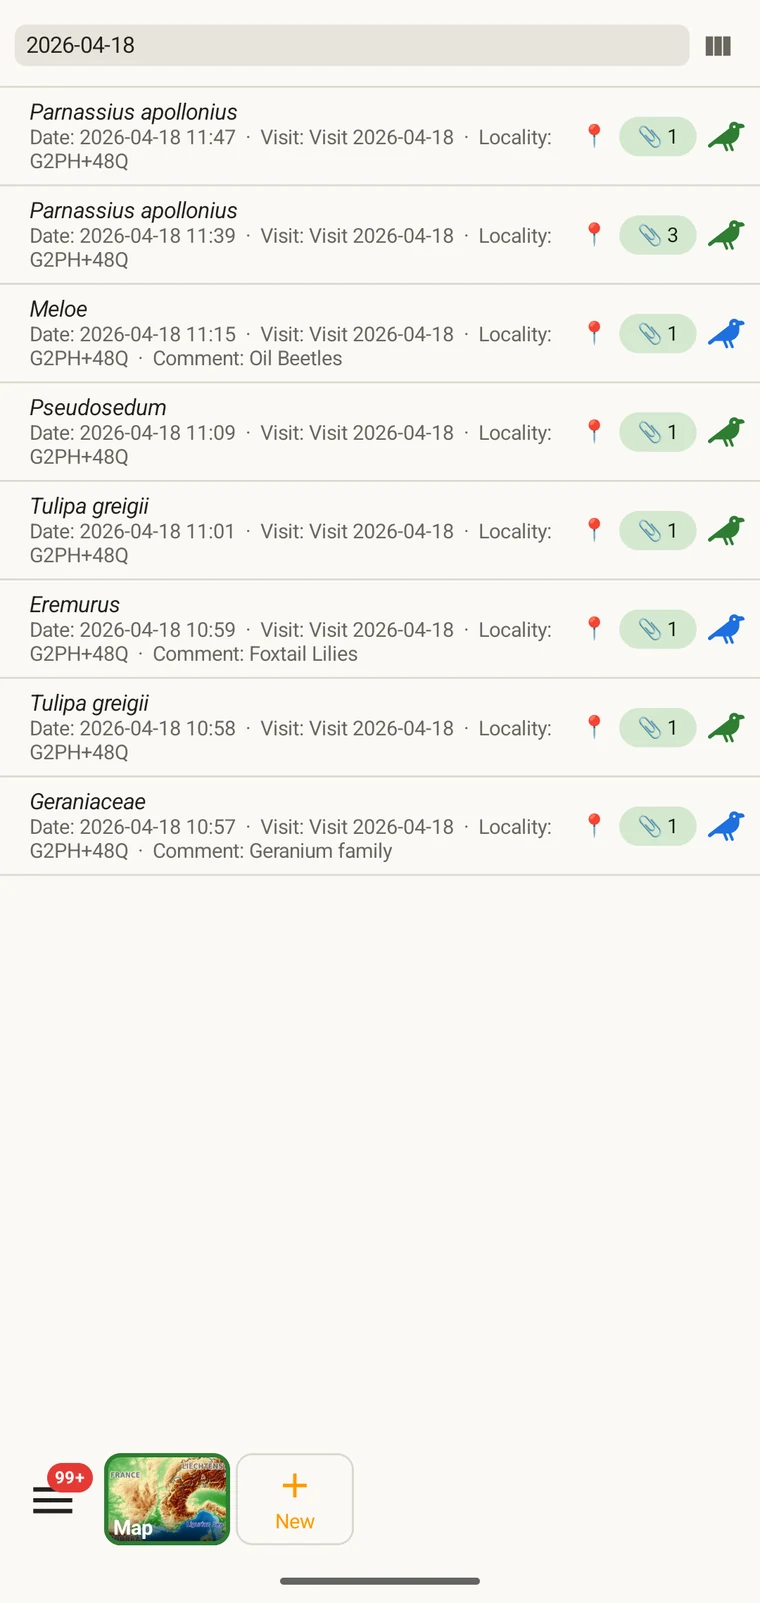
Example — everything recorded on one date. Type the date, for example 2026-04-18, into the filter box. Every observation from that day remains; clear the box to see all rows again.
Filtering matches text that is present. To find records where a field was left blank, add that field as a column and scan the list, or sort by that column on a tablet so the empty cells group together.
Visits and localities
The visits list and the localities list let you review the spatial and temporal structure of the project separately from the observations themselves.
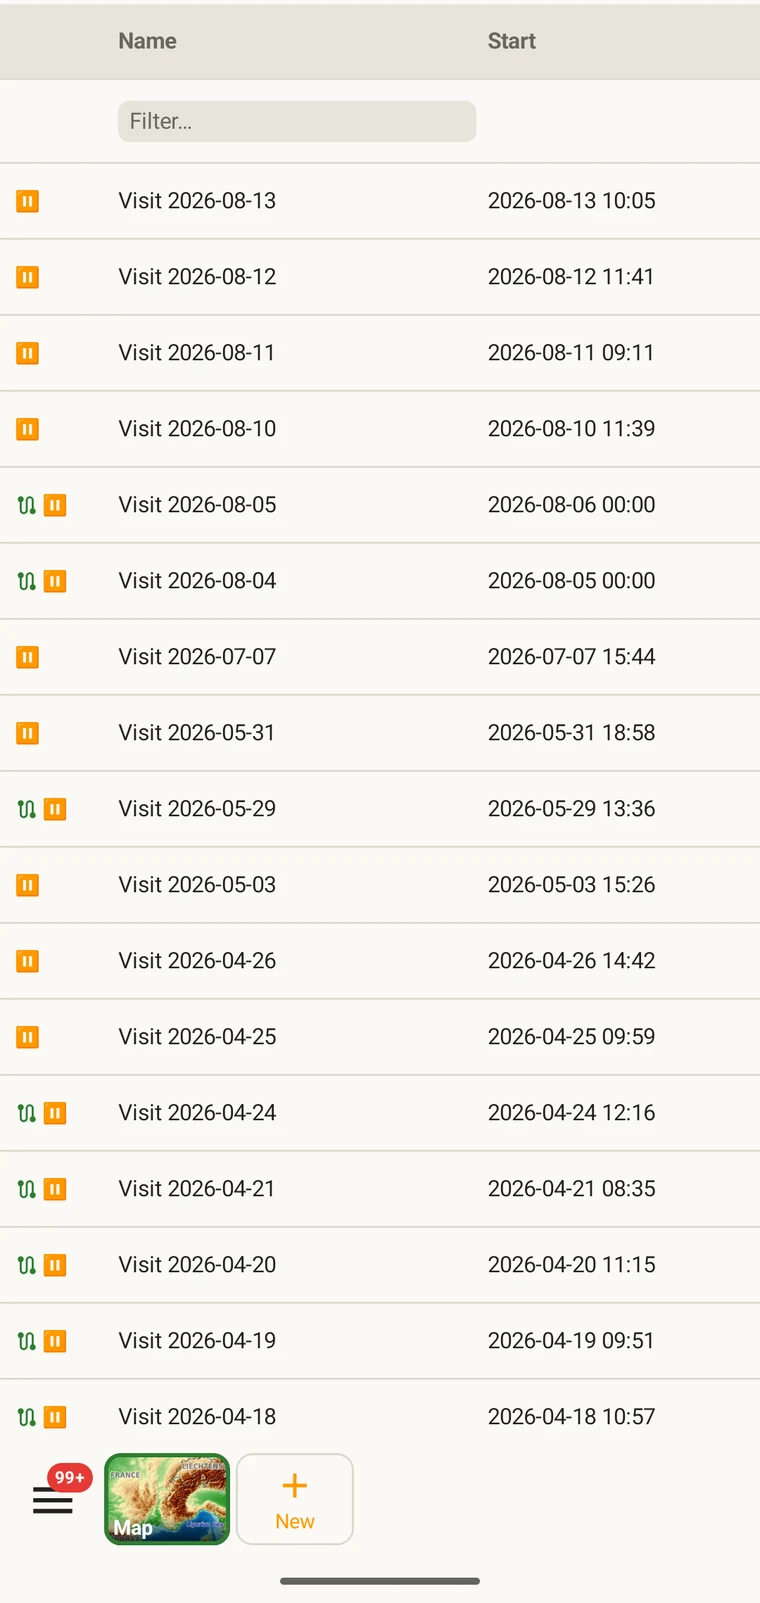
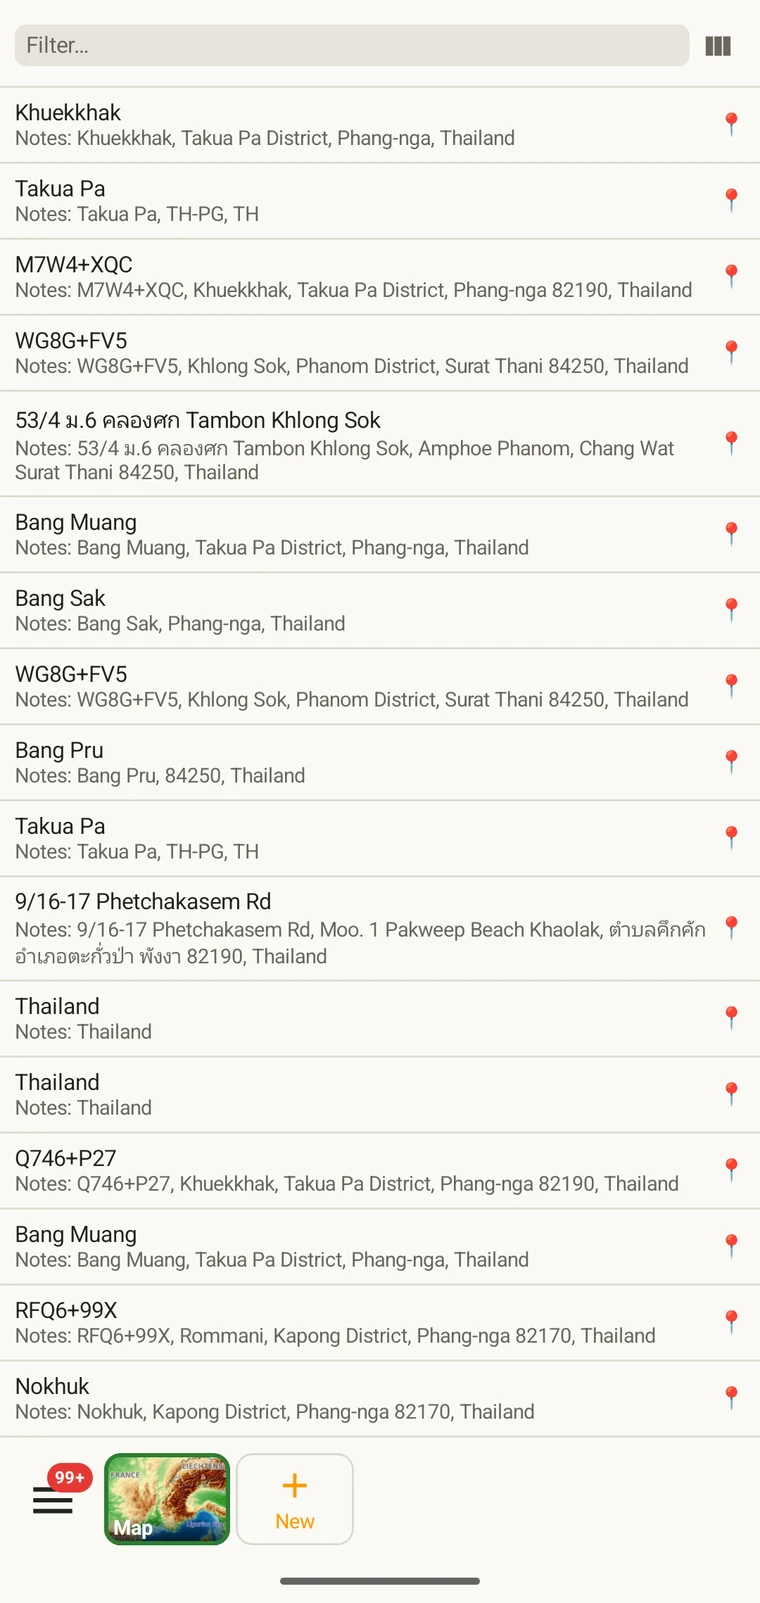
A visit is the survey event that connects a locality to a set of observations made during one session. Opening a visit from this list shows which observations were recorded under it. The localities list shows every named place in the project; tapping one opens its form so you can check or correct its name and position. Both lists filter and open to their edit forms in the same way as the observation list. See Recording observations for how visits and localities are created in the field.
Taxa
The taxa list opens on My species — the taxa recorded in the project. Switch to All names to browse the downloaded Catalogue of Life names.
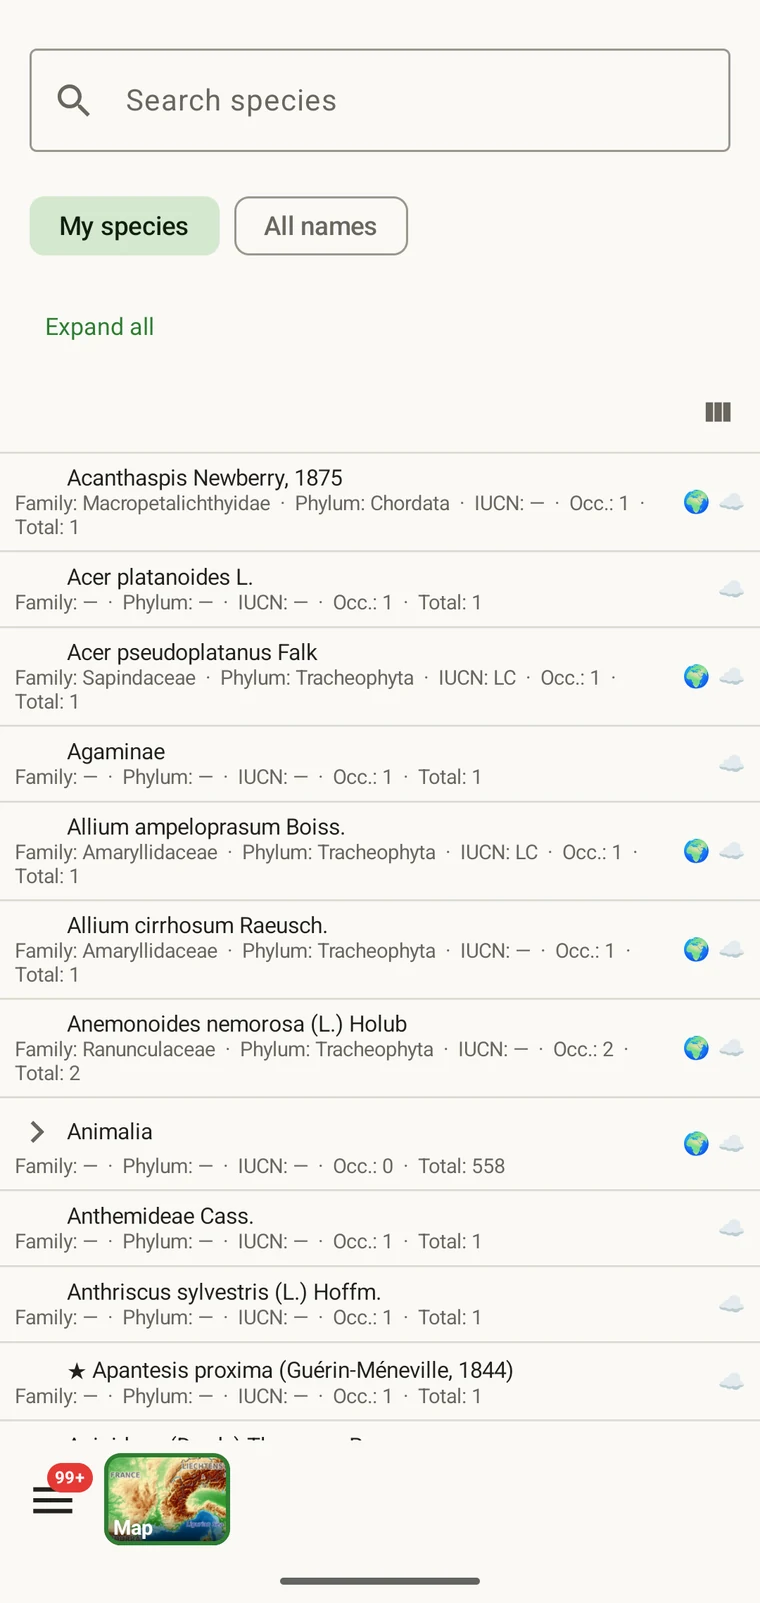
My species is the useful view before export, because it is the project's working species list. It is where you check for spelling inconsistencies and near-duplicate names that arose from entering the same species differently across sessions — for example Tulipa greigii entered once with a capital G, or a vernacular name used as a taxon name on one record. The full reference taxonomy is also available through the search on the observation entry form (see Recording observations).
Photos
The files view presents every image attached to the project in a single grid.
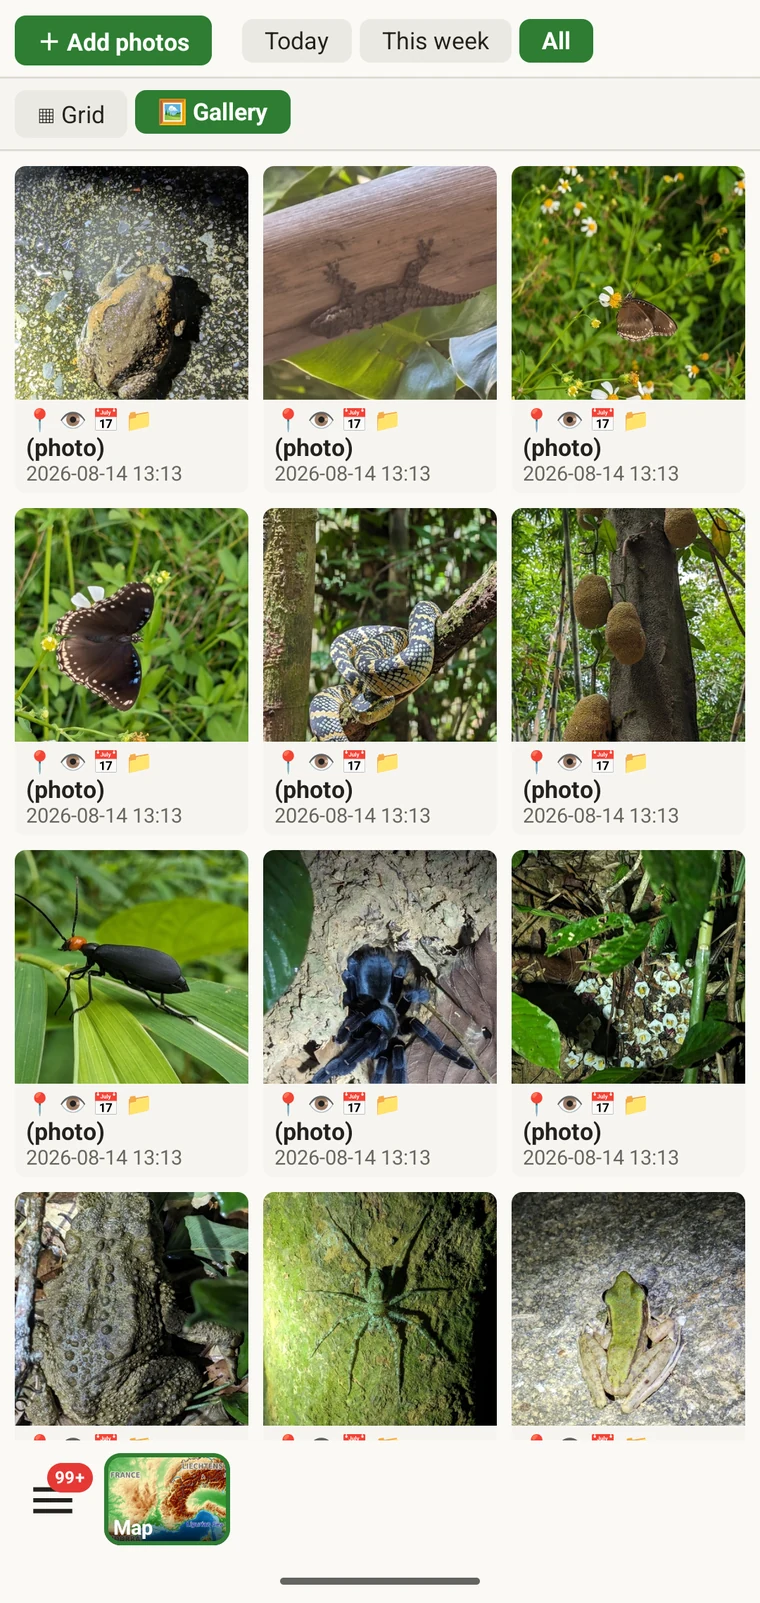
The practical use is confirming that photos actually attached to the records you think they did. When recording in the field it is easy to capture a photo and move on before it has finished attaching, or to attach it to the wrong observation. The gallery gives you a count and a visual check: if you recorded ten observations and the gallery shows seven photos, there are three records without one. Tap any photo to navigate to its parent record.
Correcting data before export
A short pass through the lists before you export catches the most common field problems.
- Open the taxa list and scan for near-duplicate names — the same species entered with a spelling variation or a different rank. Correct the offending observation records so the taxon name is consistent throughout.
- Open the observation list, add the field you consider required in practice to the visible columns, then scan or sort that column for empty cells. Open each flagged record and fill in the missing value.
- Switch to the map and switch the basemap to Outline (see Map tools) so your own points are clearly visible against a plain background. Positions that landed in water or in the wrong valley stand out immediately. Tap to open and move the offending record.
- Check the photo gallery to confirm the image count matches expectations. Open any photo that looks misattributed and reassign it.
- When the data looks right, go to Export formats.
Where the data is stored
All records are stored in a single SQLite database on the device. No account is required to create or read data, and your records leave the device only when you export them or use a connected service (Google Drive, Dropbox, Zenodo, iNaturalist). Map tiles, weather, GBIF look-ups and AI identification are fetched from their providers when you use those features. Recording works entirely offline from the moment you create a project.
A full SQLite backup is one of the twelve export formats. It produces a .db file that is a complete copy of the app's database — every project, every table as it sits on disk — readable by any SQLite tool. It is for analysis and archiving, not for restoring into the app; for device-to-device backup use Backup & Restore under Menu → Admin → Account, which backs the database up to Google Drive. See Export formats for all twelve options.