
Map and terrain
Map tools
The measurement, legend, data and styling tools described here read the vector tiles already stored on the device. They work the same online and offline, and need no connection once an area has been downloaded.
The toolbar
Five buttons run across the top of the map screen. Each opens a distinct panel or action.

| Item | What it opens |
|---|---|
| Menu | The app's navigation drawer — project, settings, lists |
| Topo | The basemap picker: Topographic, Streets, Satellite. Described in Map and tile server |
| Legend | The feature legend for a point you tap on the map — land cover, water, paths, contours, place names |
| Data | Which of your own data layers are drawn: Observations, Localities, Visits, Tracks, Base map |
| Tools | A sheet with Measure, Search, Brightness, and Offline |
The Tools sheet
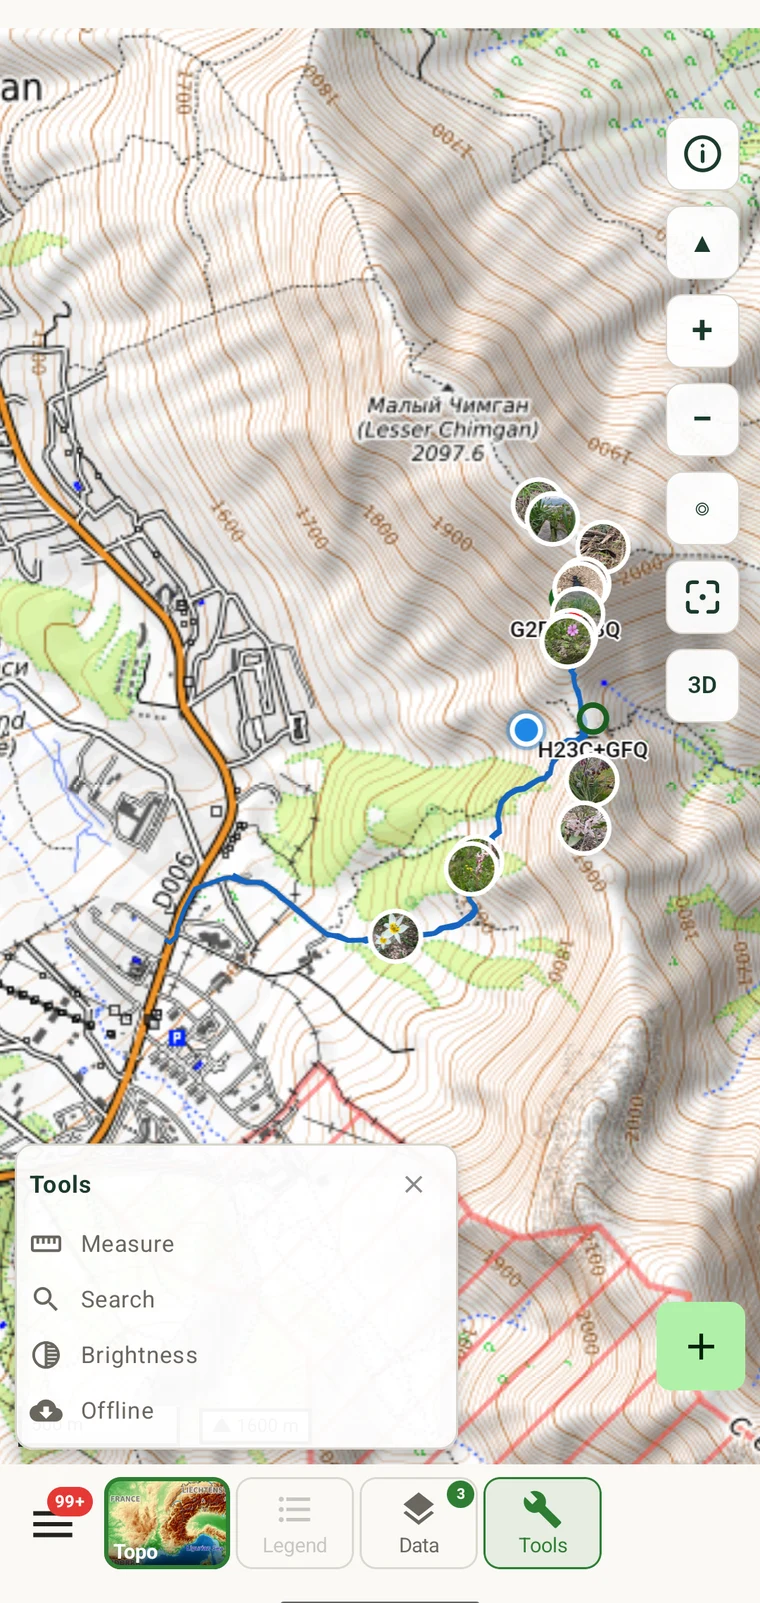
Tap Tools in the toolbar to open the sheet. Its entries are listed below.
| Entry | What it does |
|---|---|
| Measure | Place vertices on the map to measure distance, area and elevation profile |
| Search | Find a named place on the map |
| Brightness | Dim or brighten the basemap independently of device backlight |
| Offline | Download map areas for offline use |
The Offline entry is documented in Offline maps.
Measuring distance and area
Tap Measure in the Tools sheet to enter the measurement mode. In this mode each tap on the map places a vertex. A line is drawn between vertices, and the running total distance updates after each tap. To measure an area, close the shape by tapping the first vertex again; the app then reports the enclosed area alongside the perimeter distance.
Below the map, an elevation profile is drawn along the line. The profile comes from the same terrain elevation data used to render 3D terrain, so it is available wherever the map is cached, with no connection. The profile shows the altitude at each vertex, together with the total climb and descent along the measured path and the gradient between each pair of vertices.

How to measure a transect or area
- Tap Tools in the toolbar, then tap Measure.
- Tap the map to place the first vertex at the start of your transect.
- Tap to place further vertices along the route. The running distance updates after each tap.
- To measure an area, tap the first vertex again to close the polygon. The area and perimeter are shown.
- Read the elevation profile below the map for climb, descent and gradient along the line.
- Tap the close button or navigate away to exit measurement mode.
Map distance versus slope distance
The distance shown is the horizontal (plan) distance between vertices, measured on the map projection. On sloping ground the actual path you walk is longer by an amount that grows with the gradient. For a 30° slope, for instance, the walked distance is roughly 15% greater than the map distance. The elevation profile gives you the information to estimate this: if a segment climbs 200 m over a map distance of 500 m, the slope distance is approximately 538 m. For most transect work the distinction is noted in the field record; for precise slope distances, use a rangefinder or derive the value from the profile data.
Route and trail snapping
When you place measurement vertices near a mapped path or track, the line snaps to follow that route rather than running straight across the terrain between the two points. A straight line across a valley understates the distance of a walk that descends and climbs again. Snapping follows the trail instead.
Snapping is reconstructed on the device from the path and track network carried in the vector tiles you already downloaded. It does not contact an external routing service. This means it works anywhere the map is cached — including in areas with no mobile signal — and it works for the same paths and tracks shown on the topographic basemap, whether those are maintained trails, forest tracks or fieldwork routes marked in OpenStreetMap.
Coverage follows the basemap. Snapping can only follow paths that are mapped in the OpenStreetMap data underlying the tiles. If a trail is not on the basemap it will not snap. In that case the measurement follows the straight line between vertices you place, and slope correction from the elevation profile applies.
The feature legend
Tap Legend in the toolbar, then tap any point on the map. The legend reports the vector features that exist at that location: land cover class, water body type, path or track classification, the nearest contour heights, and place names. The information comes directly from the tile data — it is not an interpretation by the app.
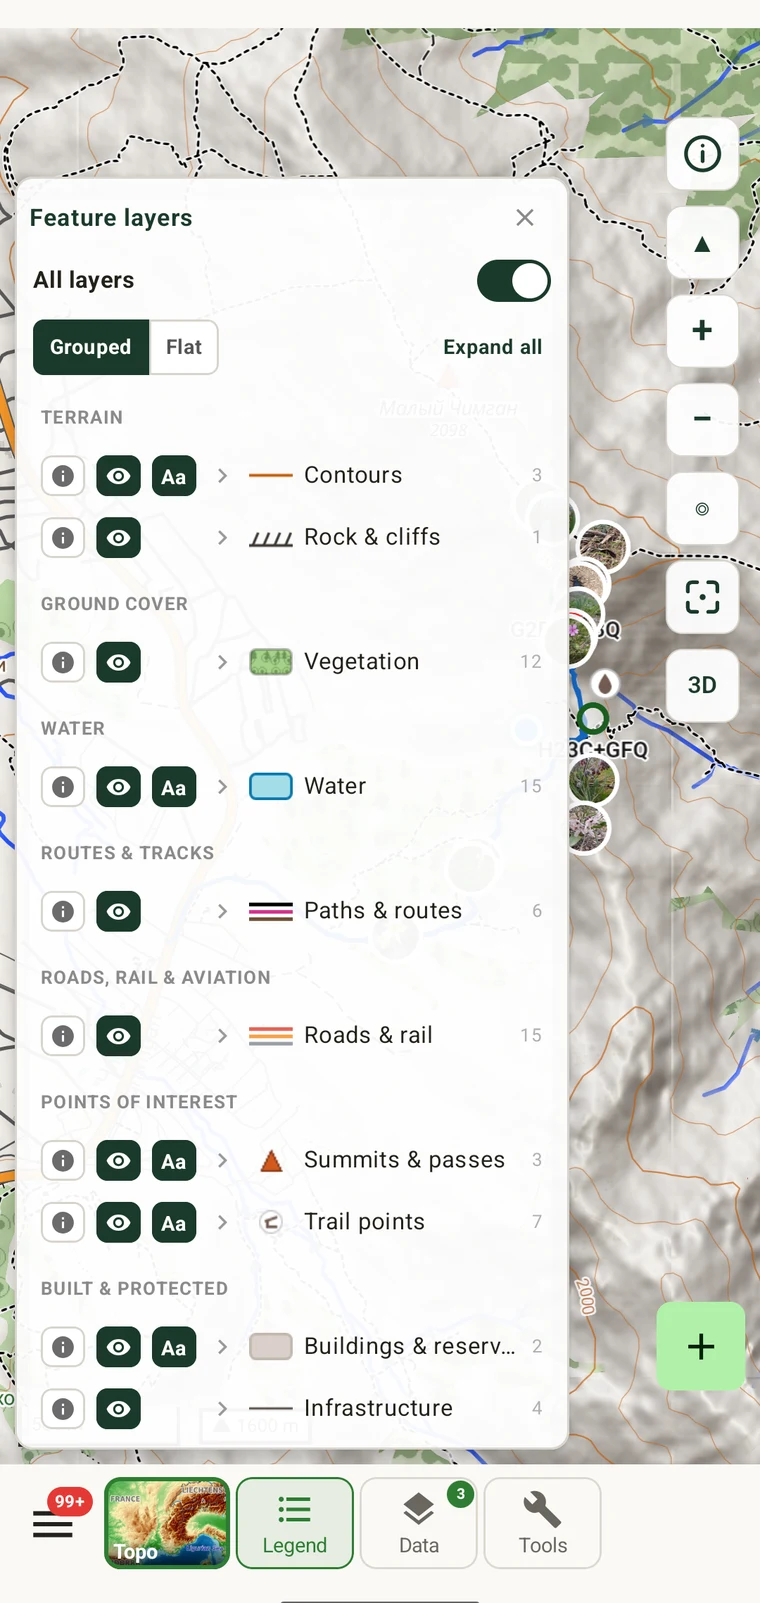
The legend is useful when entering a habitat description in an observation record: you can confirm the land cover class and path type at a tapped location rather than estimating from context. It is also a quick way to read contour heights without counting contour lines on the map.
Data layers
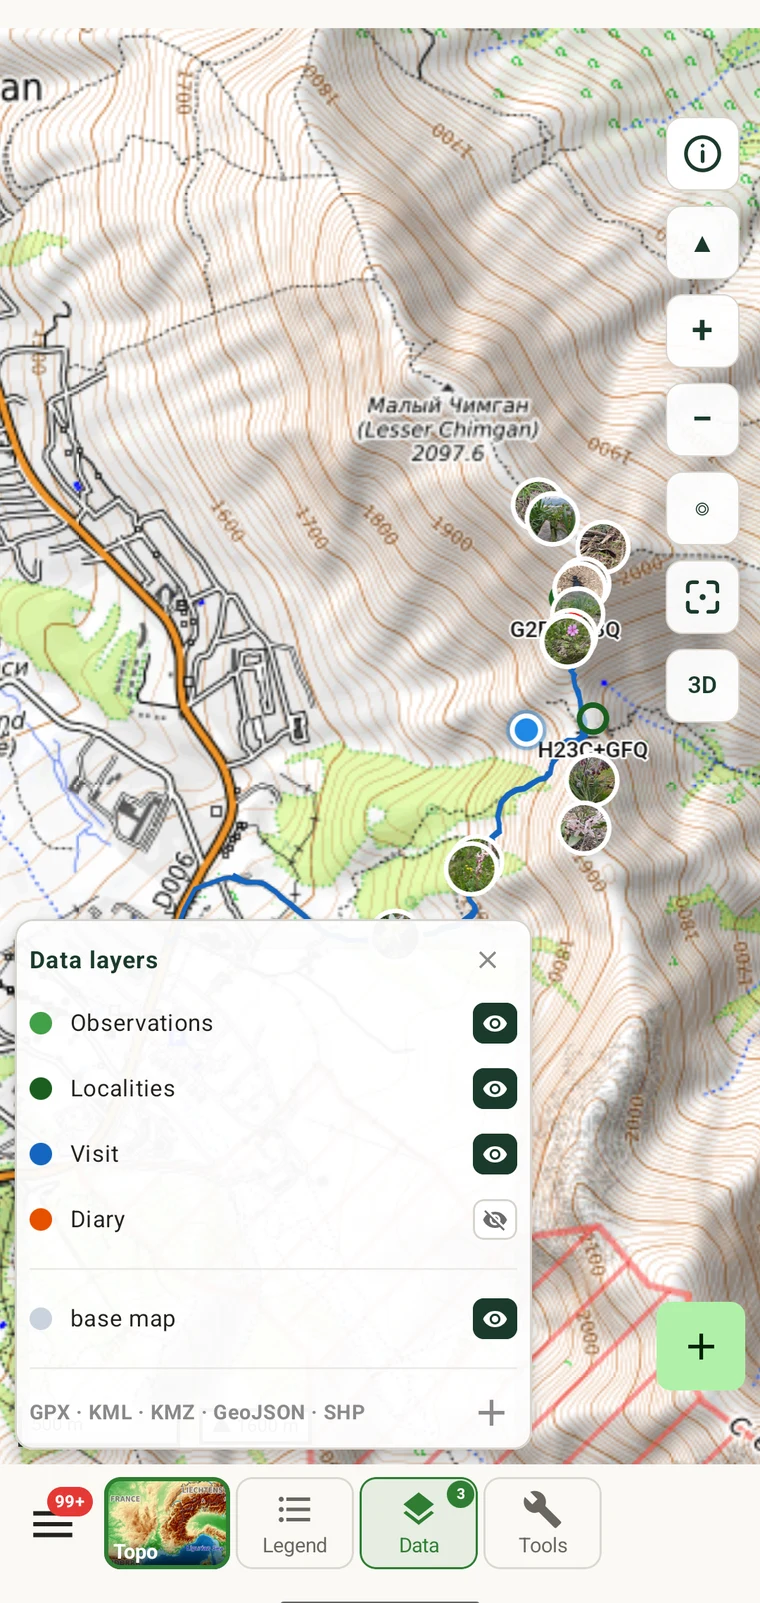
Tap Data in the toolbar to open the data layers panel. Five toggles control which of your own records are drawn on the map, and whether the basemap itself is visible.
| Layer | What it draws |
|---|---|
| Observations | Individual observation records, drawn at the GPS position recorded with each one |
| Localities | Named place localities associated with the project |
| Visits | Visit records, shown at their associated locality or GPS position |
| Tracks | Recorded GPS tracks from fieldwork sessions |
| Base map | The topographic or other basemap tiles themselves |
Turning the base map off leaves your own records on a plain background. This is a direct way to assess spatial coverage and gaps in your data, because the topographic detail no longer obscures the distribution of the records.
Marker styling
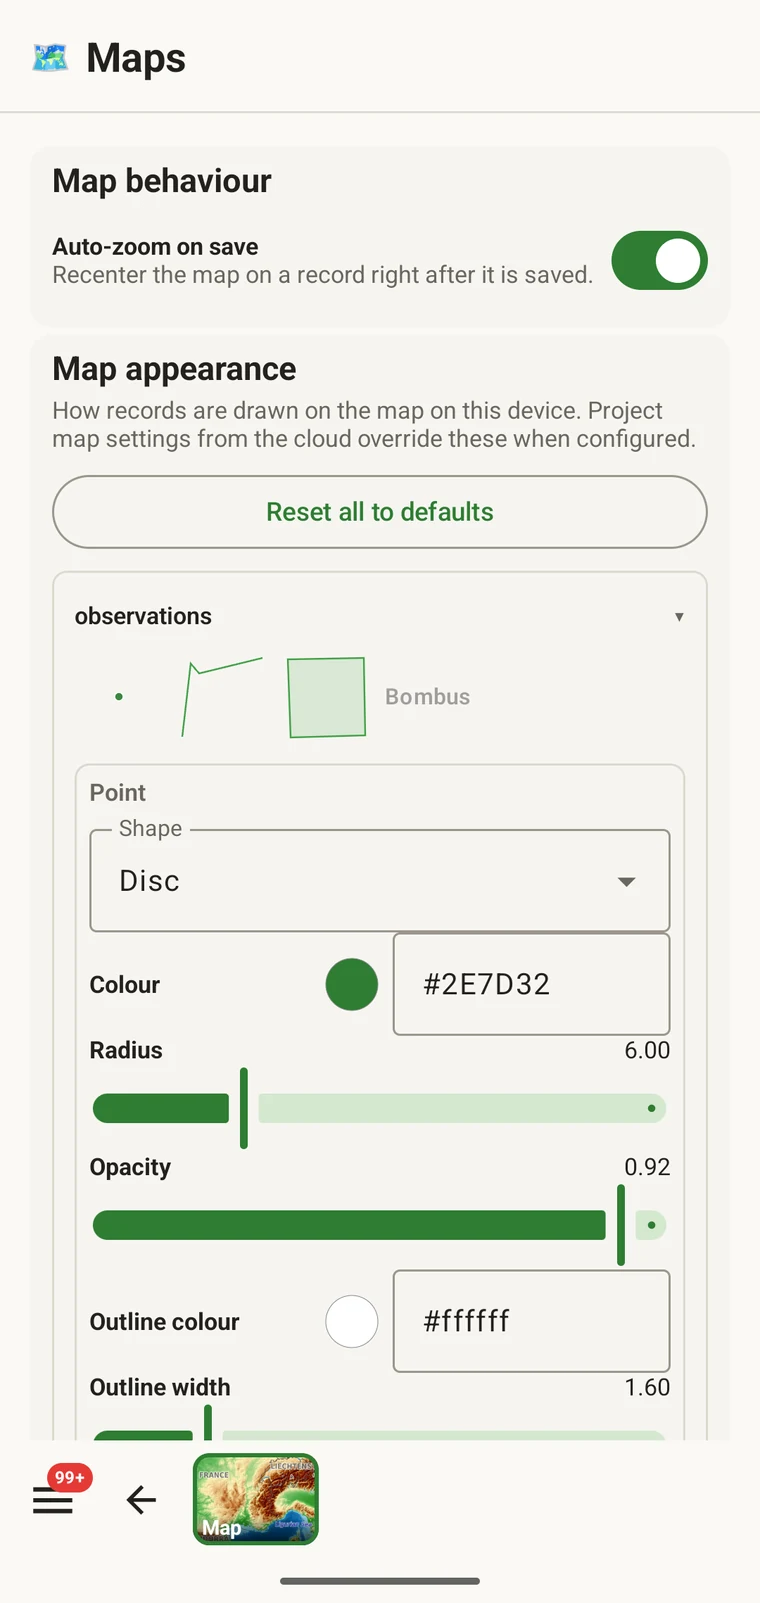
Open the map settings from the map screen to configure how each type of record is drawn. Settings are per entity type — observations, localities and visits can each carry a distinct appearance.
| Setting | What it controls |
|---|---|
| Auto-zoom on tap | Whether tapping a marker moves and zooms the map to that record. Turn it off to keep a fixed scale while reviewing records |
| Map appearance | Overall display style of the map (separate from basemap style) |
| Shape | Marker geometry for this entity type. The default is Disc |
| Colour | Fill colour of the marker, set as a hex value (default #43a047) |
| Radius | Marker size in screen units |
| Opacity | Fill transparency, from fully opaque to transparent |
| Outline colour | Colour of the marker's border stroke (default #ffffff) |
| Outline width | Thickness of the border stroke |
A practical use for contrasting styles: if your project has both visits and localities drawn at overlapping positions on a site, give them distinct colours — for example green for observations and orange for localities. At a dense site where the records stack, contrasting colours let you distinguish record types without tapping each marker.
Brightness
Tap Brightness in the Tools sheet to open a slider that dims or brightens the basemap. The adjustment applies to the map tiles only; it does not change the device backlight or affect any other part of the app interface.
Reducing brightness is useful in two conditions: in bright outdoor sun, where a lighter basemap competes with coloured markers and measurement lines; and at dusk or in a dimly lit shelter, where a full-brightness topo map produces more visual noise than the record positions you are reading. In both cases, dimming the basemap makes the markers and measurements easier to read.
Search
Tap Search in the Tools sheet to find a named place on the map. Type a place name and select from the results to move the map to that location. This is a geocoding search — it finds places by name rather than by feature type or coordinate. Use it to navigate to a known site name before starting a survey, or to locate a toponym that appears in a specimen label or historical record.